Space Shuttle Challenger Disaster
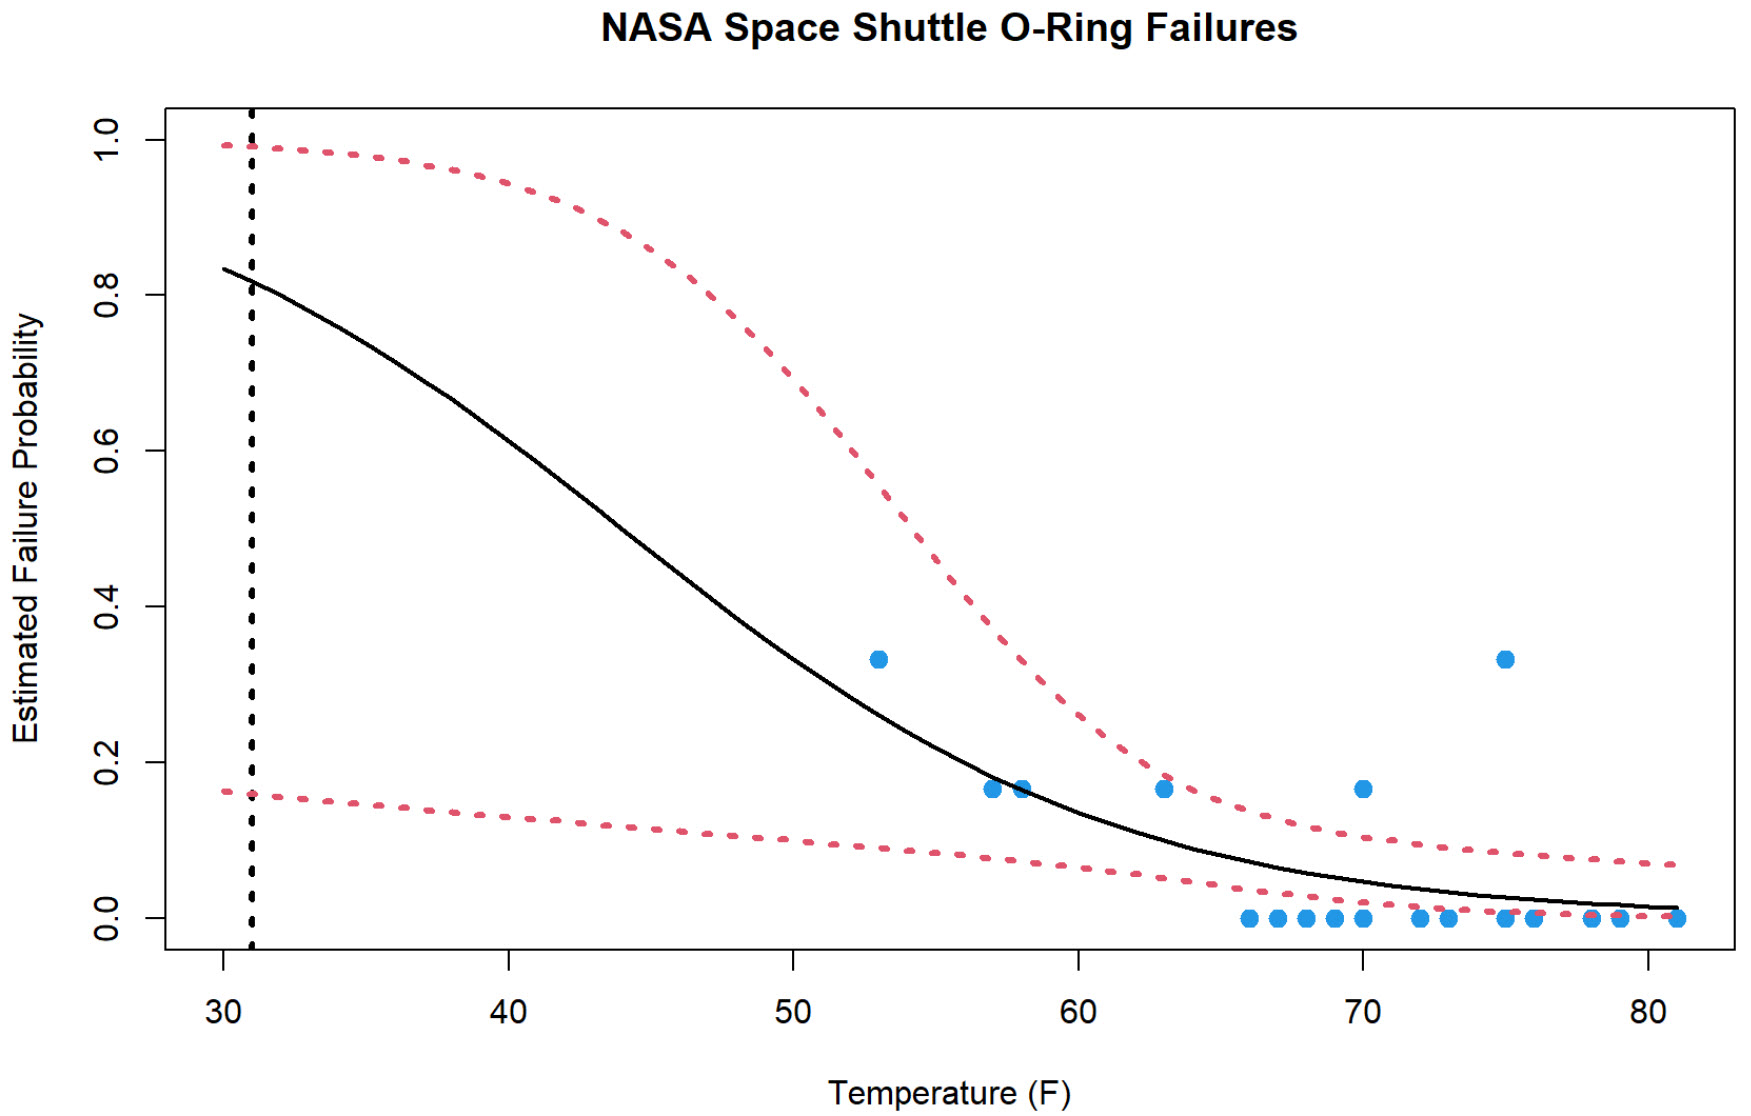
On January 28, 1986 the space shuttle Challenger disintegrated 73 seconds after liftoff from Kennedy Space Center. The most disturbing part of the space shuttle Challenger disaster was that the O-ring failure had been foreseen by the manufacturer’s engineers, who were unable to convince managers to delay the launch. Providing a better analysis and visualization of the data could have helped improve the decision-making process and potentially built a stronger case for the engineers about the effect of cold weather on O-ring functionality.