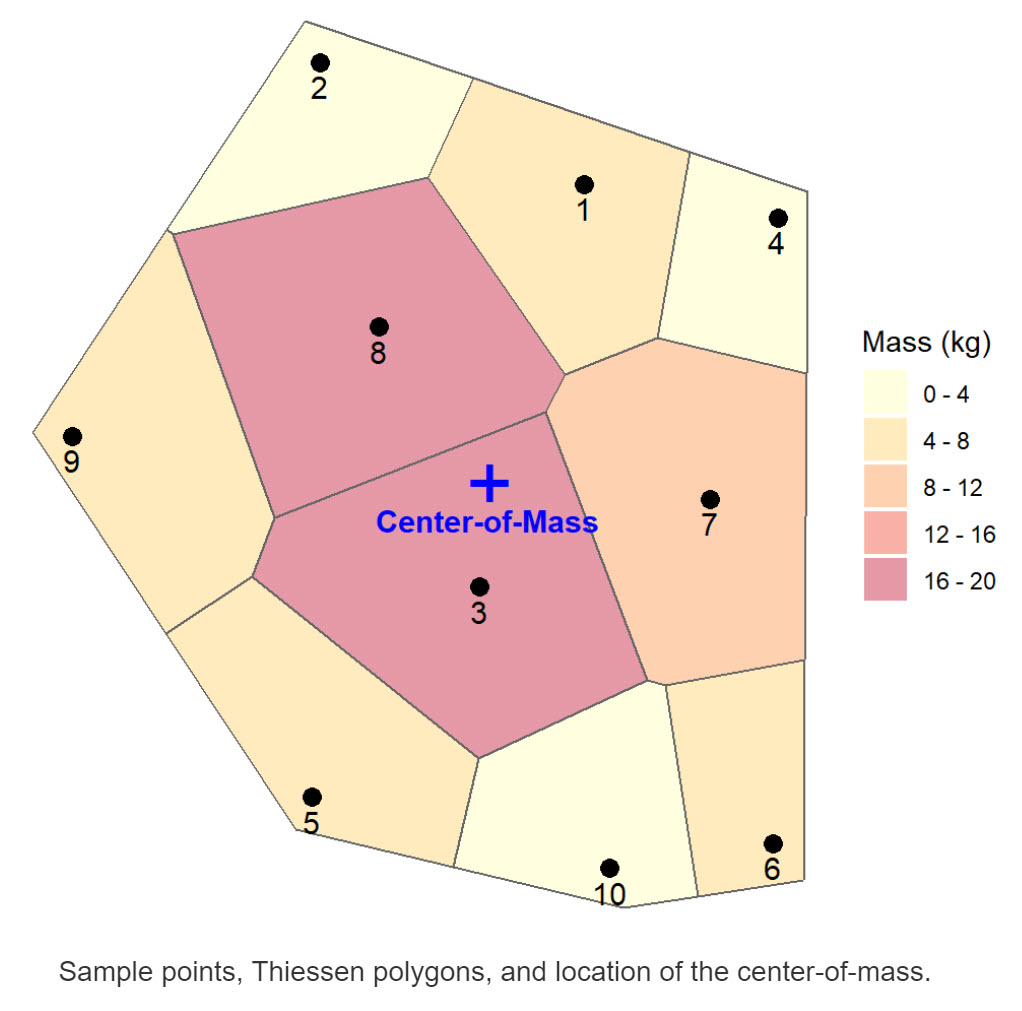
Blog

Data analytics, statistics, and more

Calculation of 95% Upper Confidence Limit for Data With No Censored Values

This post presents methods that can be used to calculate a 95% upper confidence limit on the mean of an unknown population, where all measurements are detections. The estimation methods described in this post are applicable to a random sample coming from a single statistical population.

November 1, 2022

Trend Analysis for Censored Environmental Data

This post examines several methods for conducting temporal trend analysis using censored data that do not substitute artificial values for non-detects. Parametric methods are based on censored regression using maximum likelihood estimation. Nonparametric methods are based on Kendall’s tau and the Akritas-Theil-Sen line.

October 7, 2022

2-D Density Map of Bigfoot Sightings

Data visualization is an important element of the data science process and the broader data presentation architecture discipline. This post will focus on performing some basic spatial data analysis using Bigfoot sightings in North America and the R language for statistics and visualization.

October 1, 2022

Shaded Relief Basemap Using rayshader

This post illustrates the use of rayshader, an R library that uses elevation data in a base R matrix and a combination of raytracing, hillshading algorithms, and overlays to generate 2D and 3D maps. A surface relief map created using digital elevation data will be rendered using rayshader and ggplot2.

September 6, 2022