Optimizing Groundwater Monitoring Frequencies Using Temporal Variograms
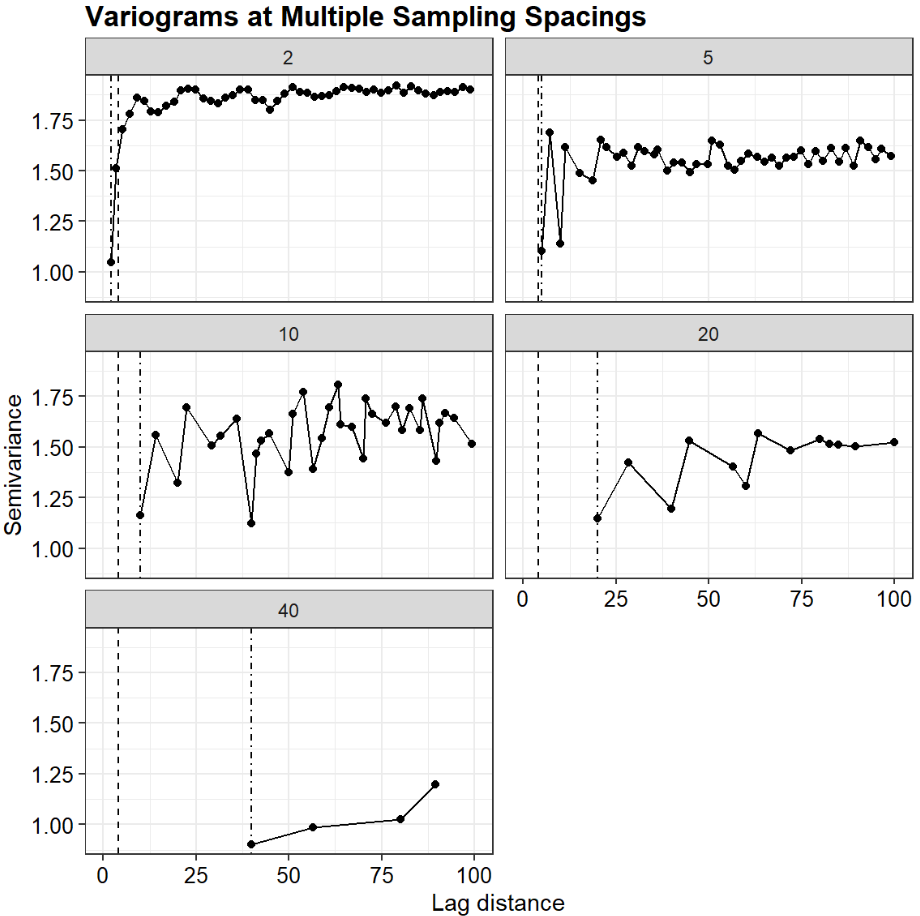
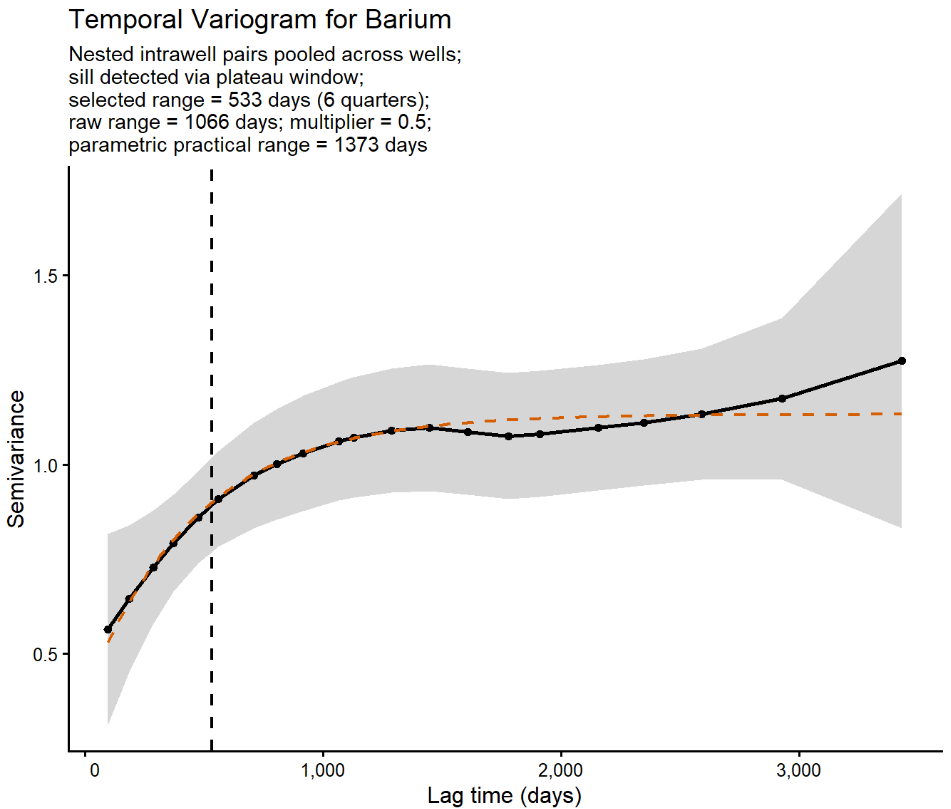
Temporal variograms provide a quantitative approach for optimizing groundwater sampling frequencies by evaluating temporal correlation in concentration data. This post presents an R-based workflow that uses nested intrawell concentration pairs to construct pooled temporal variograms, estimate temporal ranges, and recommend sampling intervals. The workflow includes automated sill detection, optional parametric variogram modeling, and user-defined sampling-interval multipliers. Example applications illustrate both successful range estimation and cases where insufficient temporal structure prevents a defensible recommendation.