Summarize Influent Flow Data Containing No Measurement Date
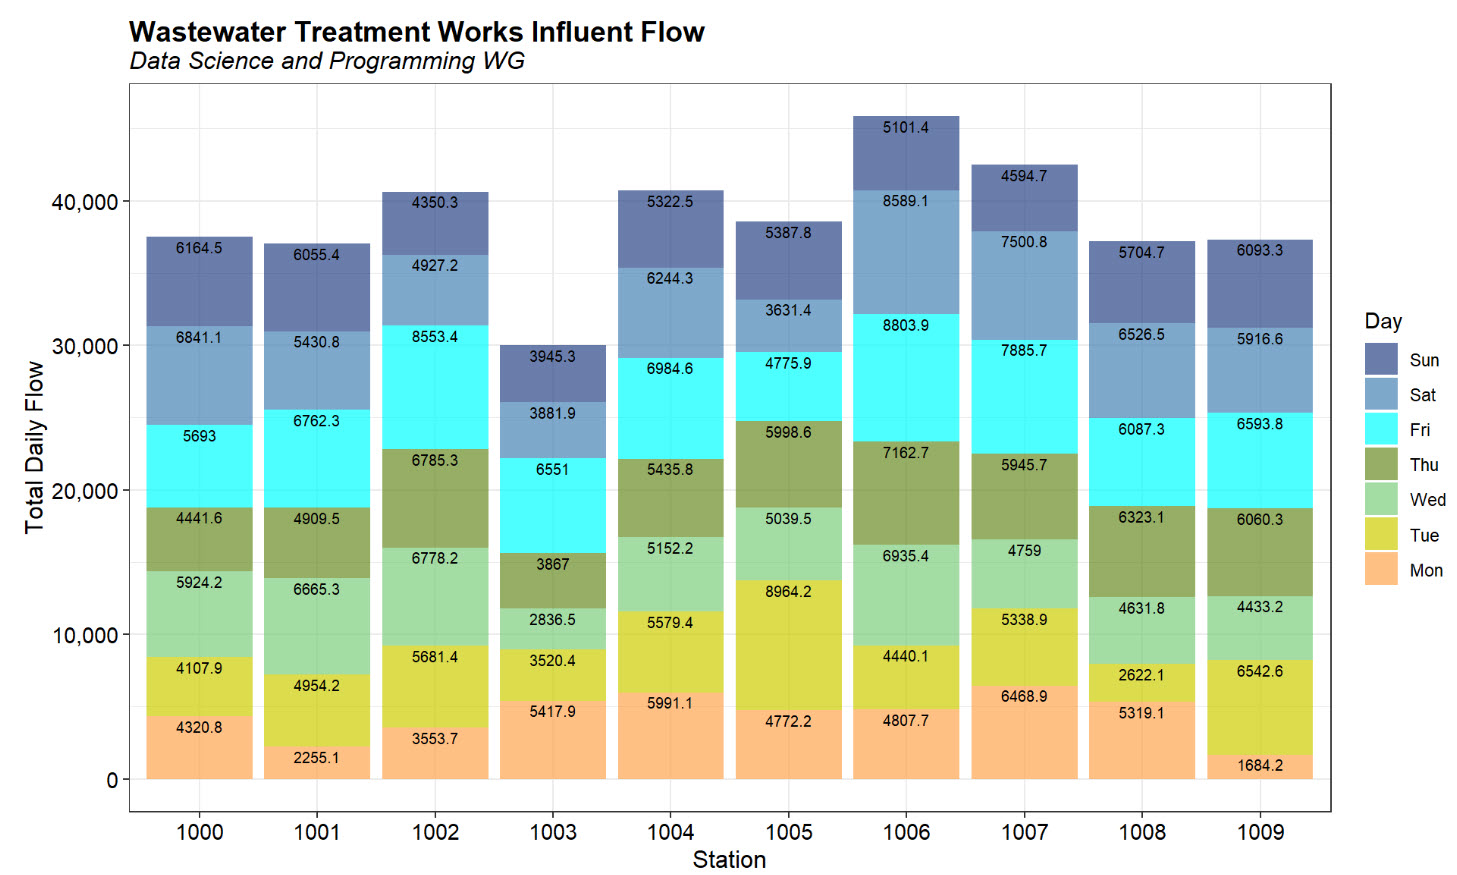
This post summarizes influent flow data containing no measurement date for 10 wastewater treatment facilities.
Data analytics, statistics, and more
This post summarizes influent flow data containing no measurement date for 10 wastewater treatment facilities.
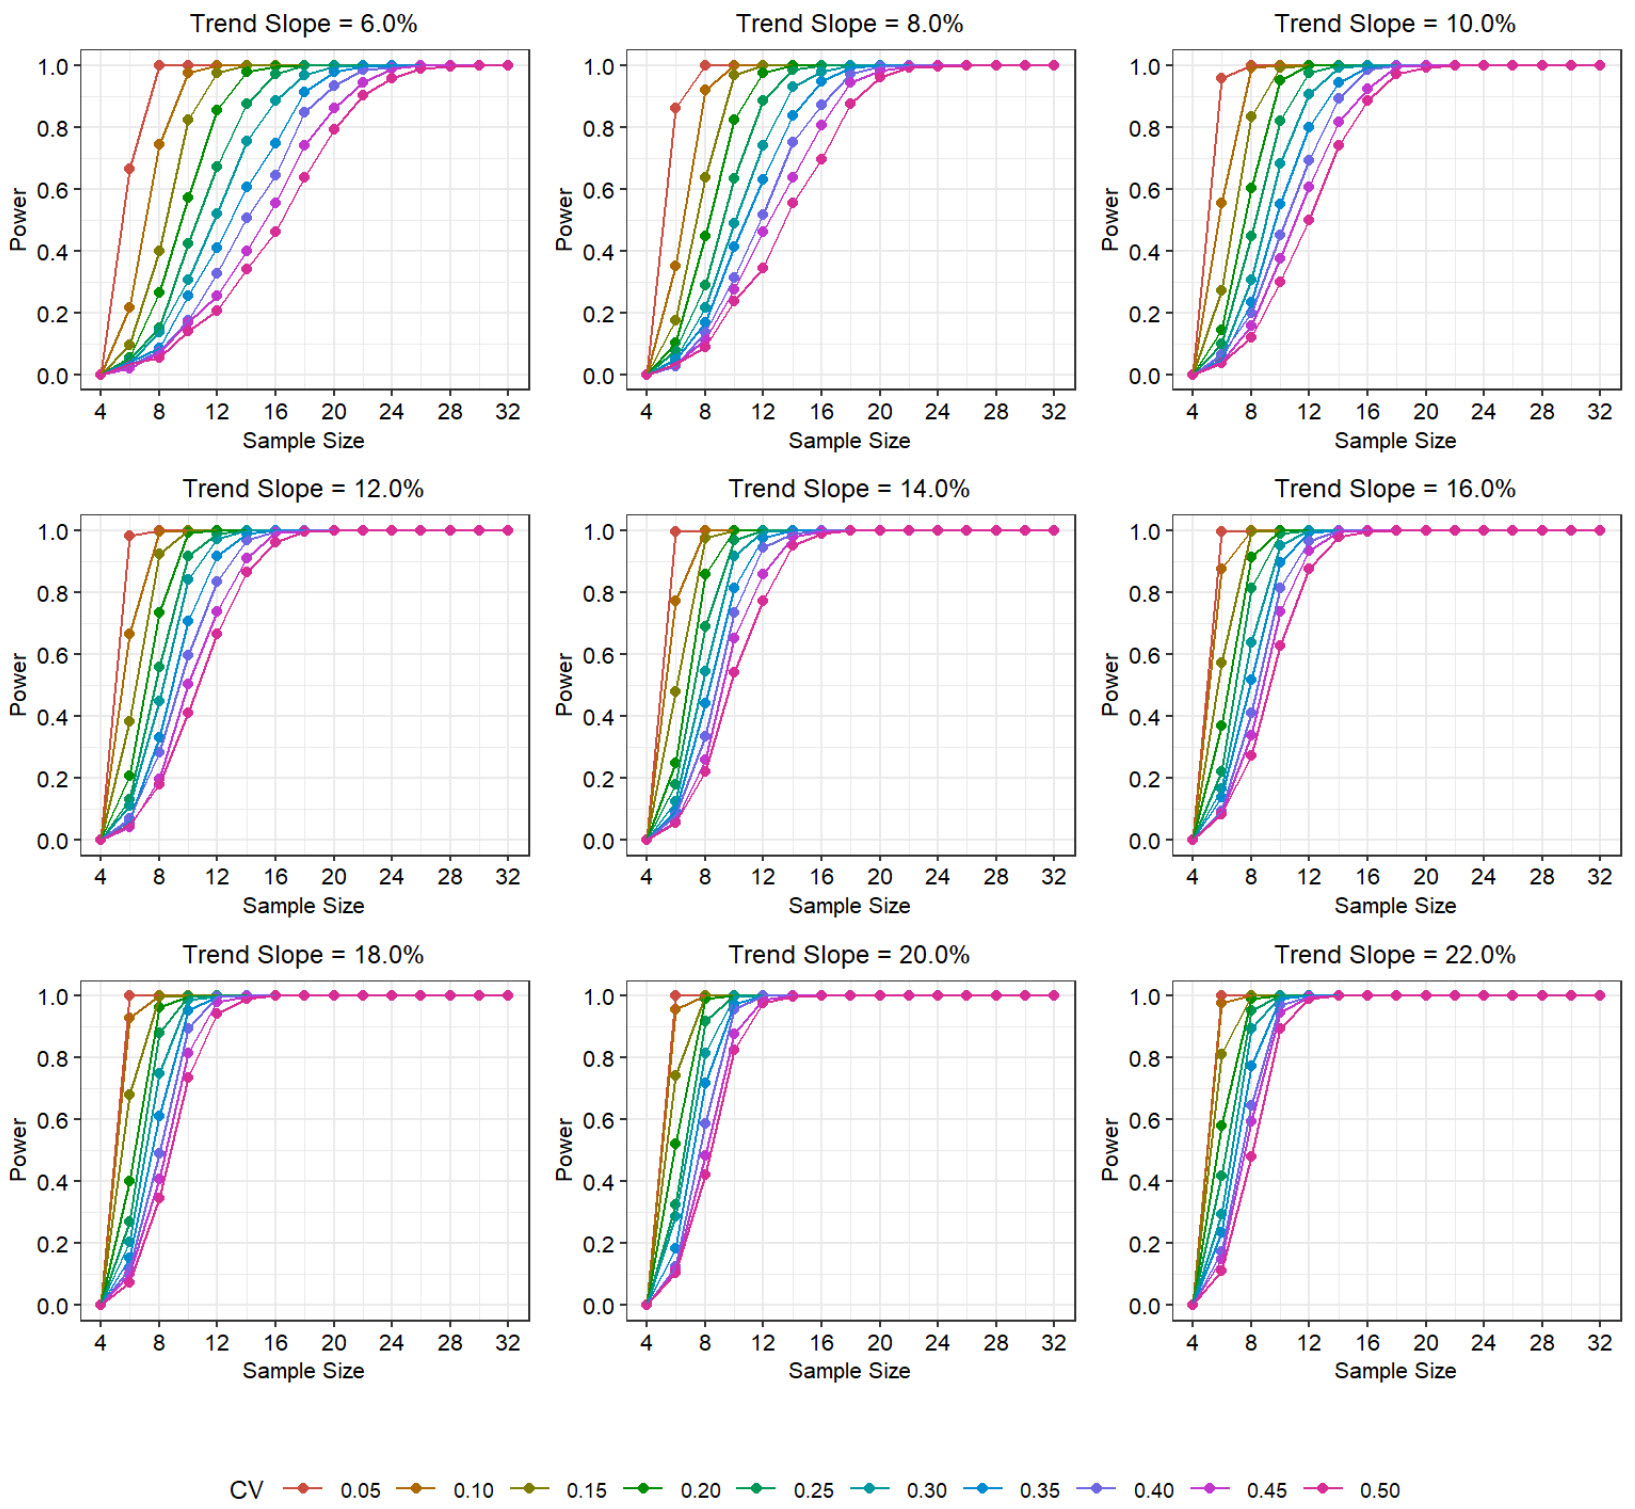
Detection of a long-term, temporal trend in environmental data is affected by a number of factors, including the size of the trend to be detected, the time span of the data, and the magnitude of variability and autocorrelation of the noise in the data. This post evaluates the power of the Mann-Kendall test to identify a trend for various combinations of trend, variability, and sample size using Monte Carlo simulation.
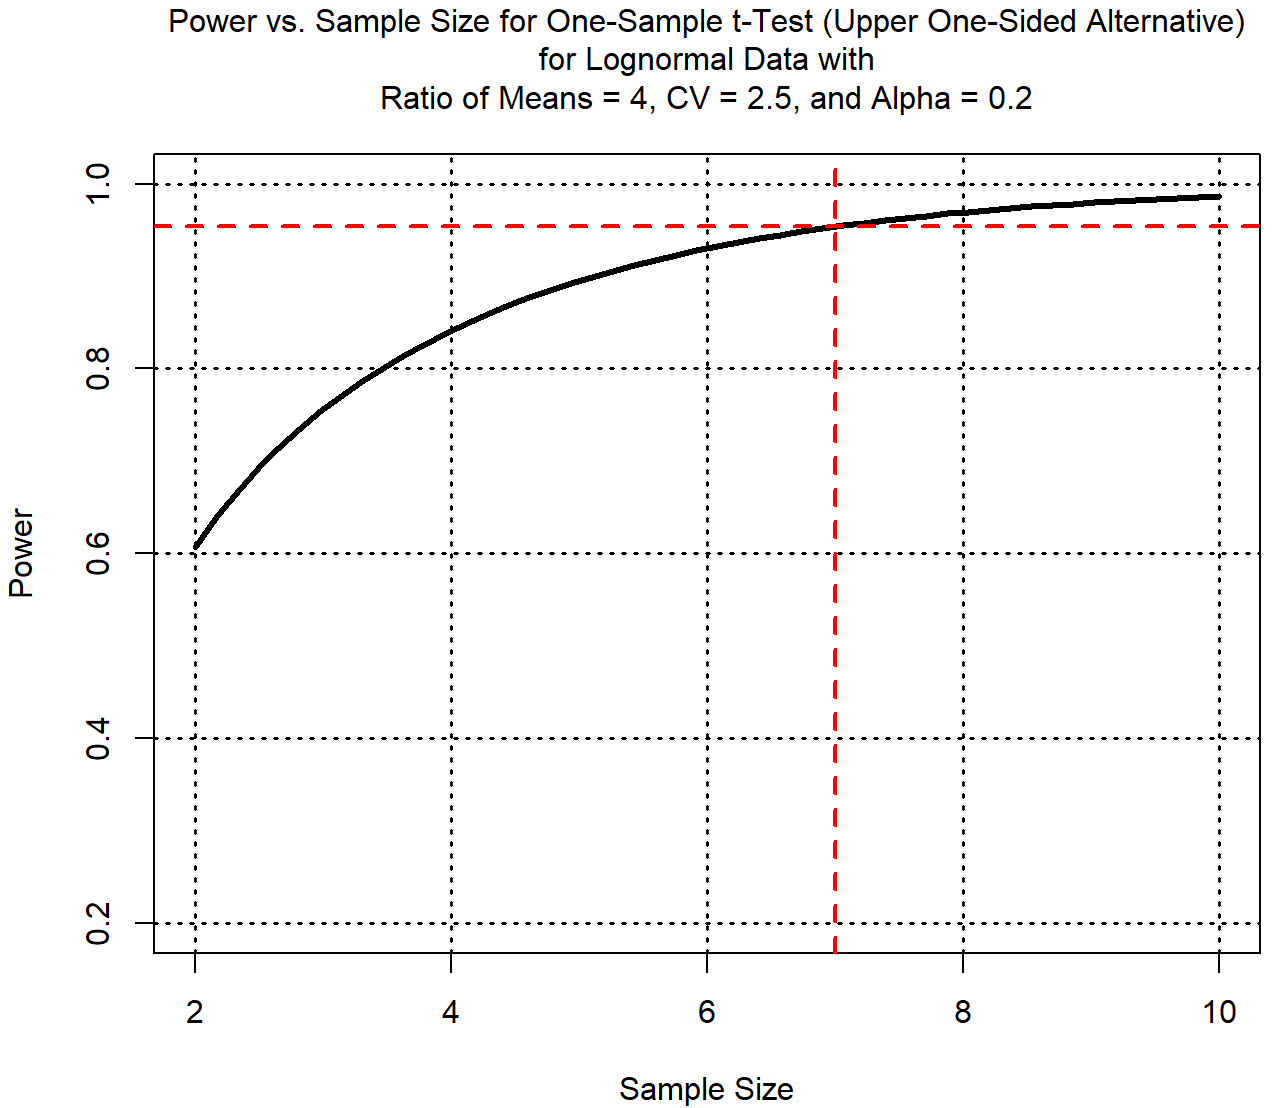
This post computes the sample size necessary to achieve a specified power for a one-sample t-test, given the ratio of means, coefficient of variation, and significance level. Calculations are based on the USEPA’s 1996 Soil Screening Guidance Document that discusses sample size calculations to determine whether soil at a potentially contaminated site needs to be investigated for possible remedial action.
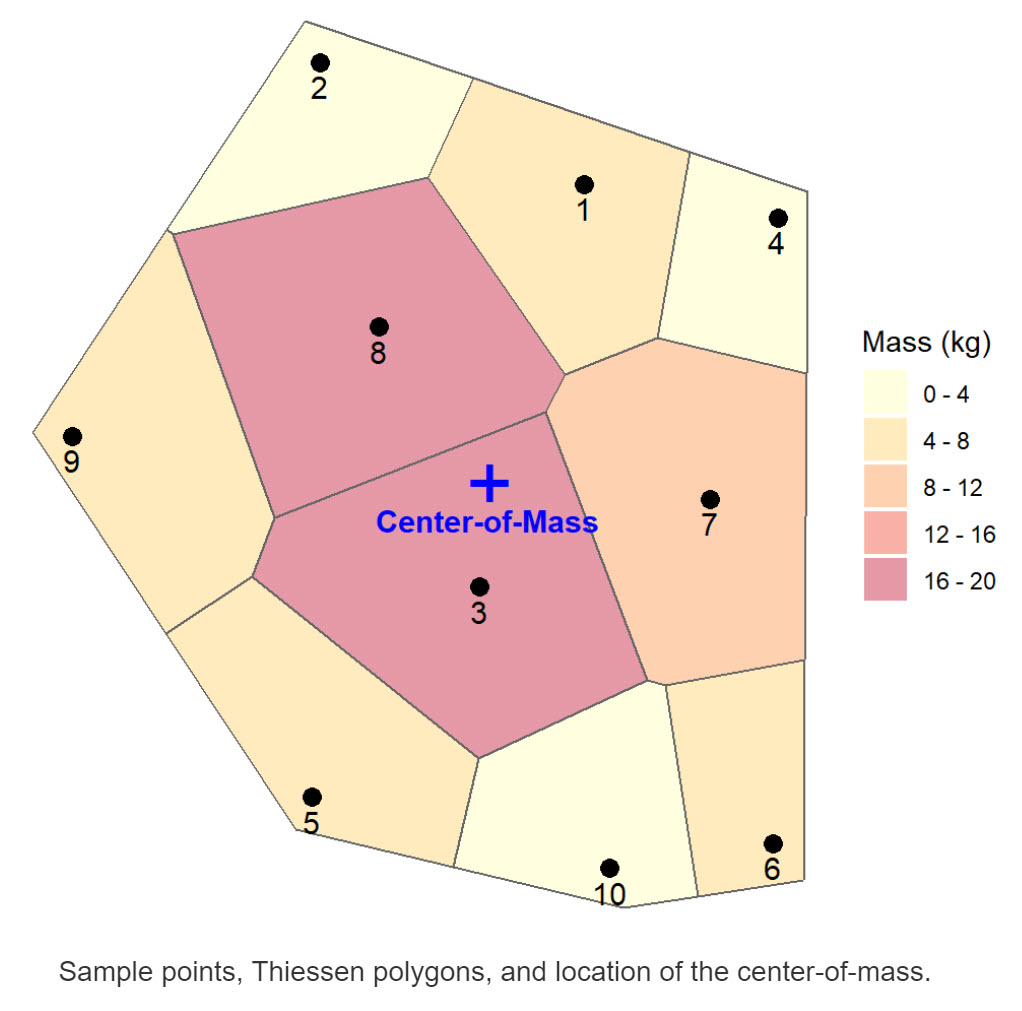
Mass-based analyses of groundwater contaminants provide complementary information not readily quantified using single-well analytics. This post describes methods that can be used to evaluate contaminant concentrations measured in wells to determine how plume mass and plume center-of-mass change through time.
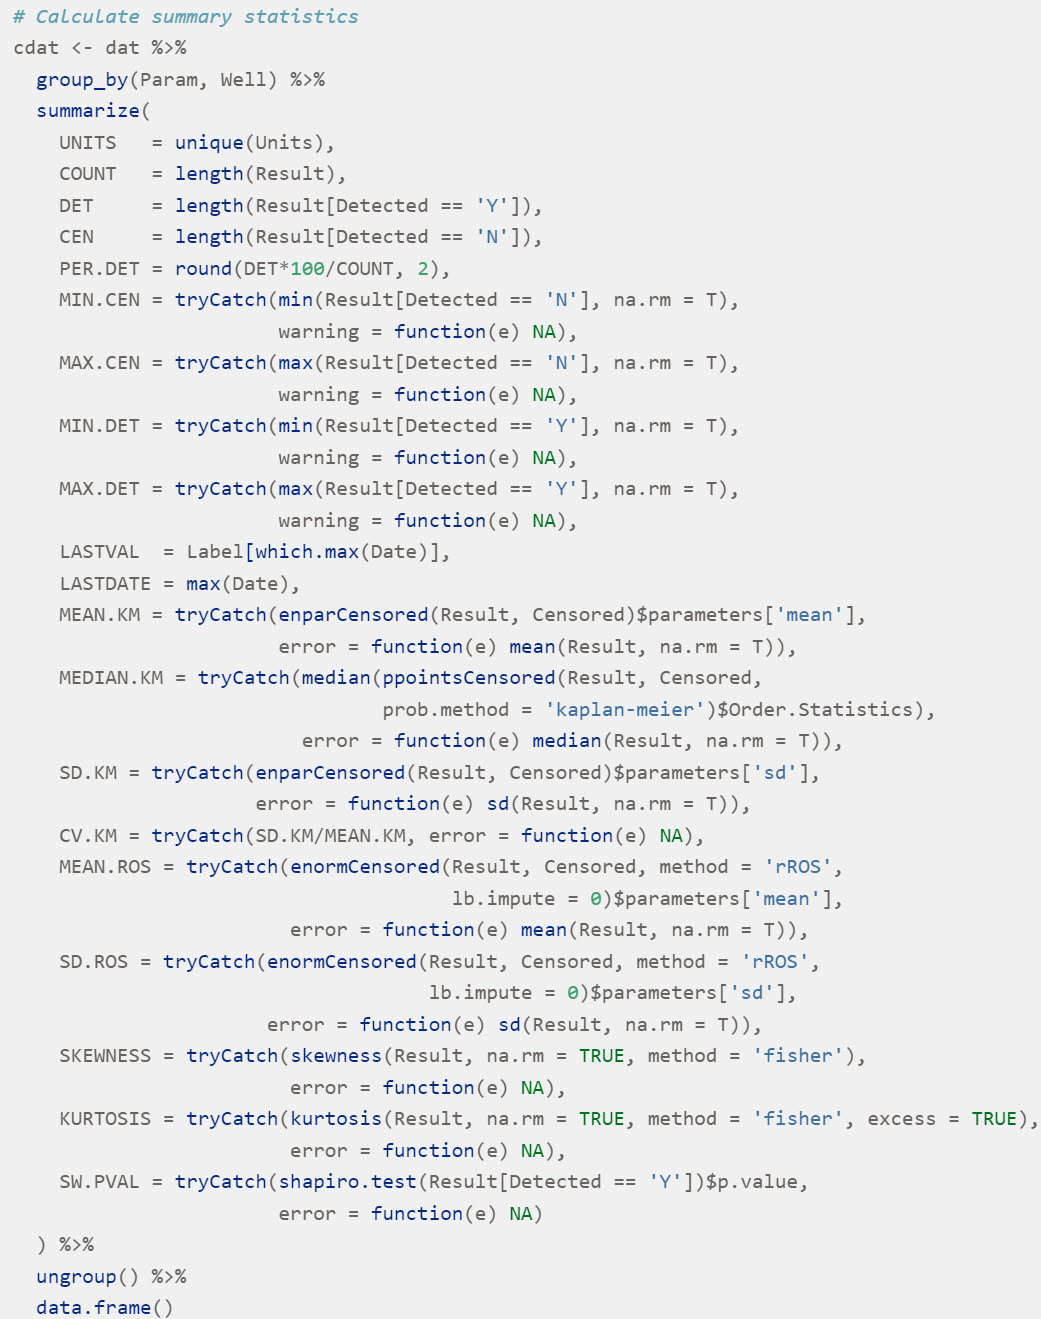
Left-censored environmental data are problematic because censored (nondetect) values are known only to range between zero and the detection or reporting limit. Fortunately, methods are available for analyzing data containing a mixture of detects and nondetects that make few or no assumptions about the data, or that substitute arbitrary values for the nondetects.
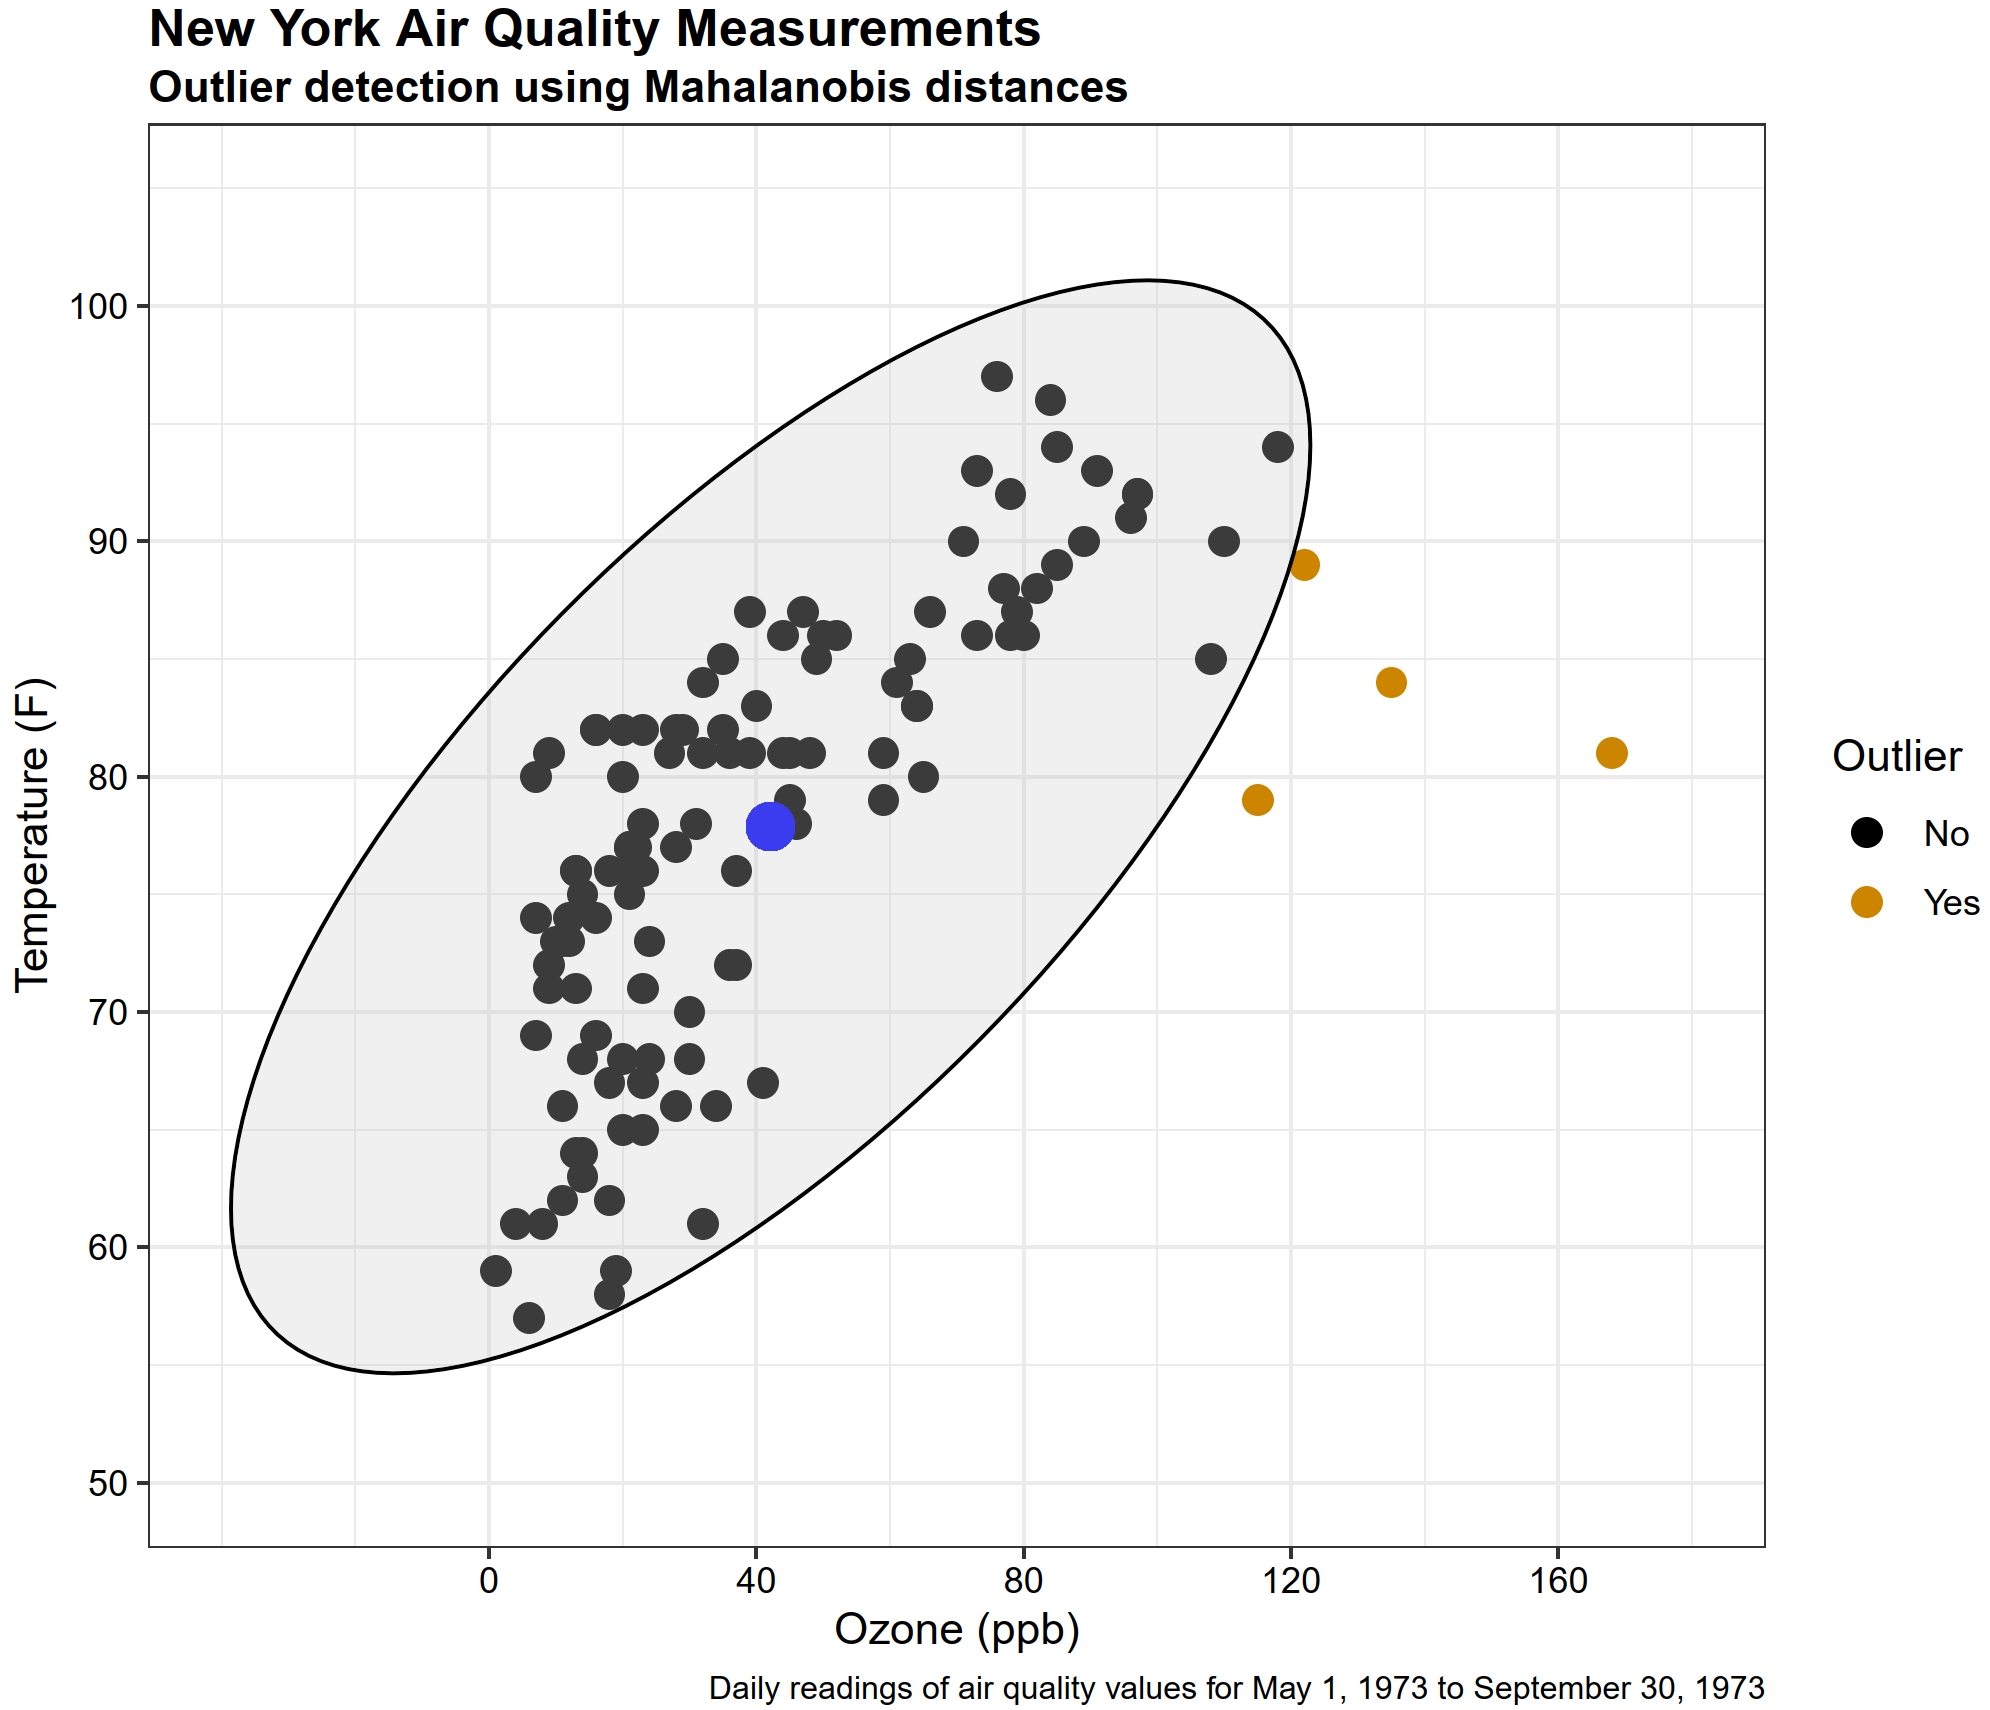
The Mahalanobis distance is a statistical technique that can be used to measure how distant a point is from the centroid of the data. Mahalanobis distances can be converted into probabilities using a chi-squared distribution. By specifying a significance level, this process is commonly used as an outlier detection method.
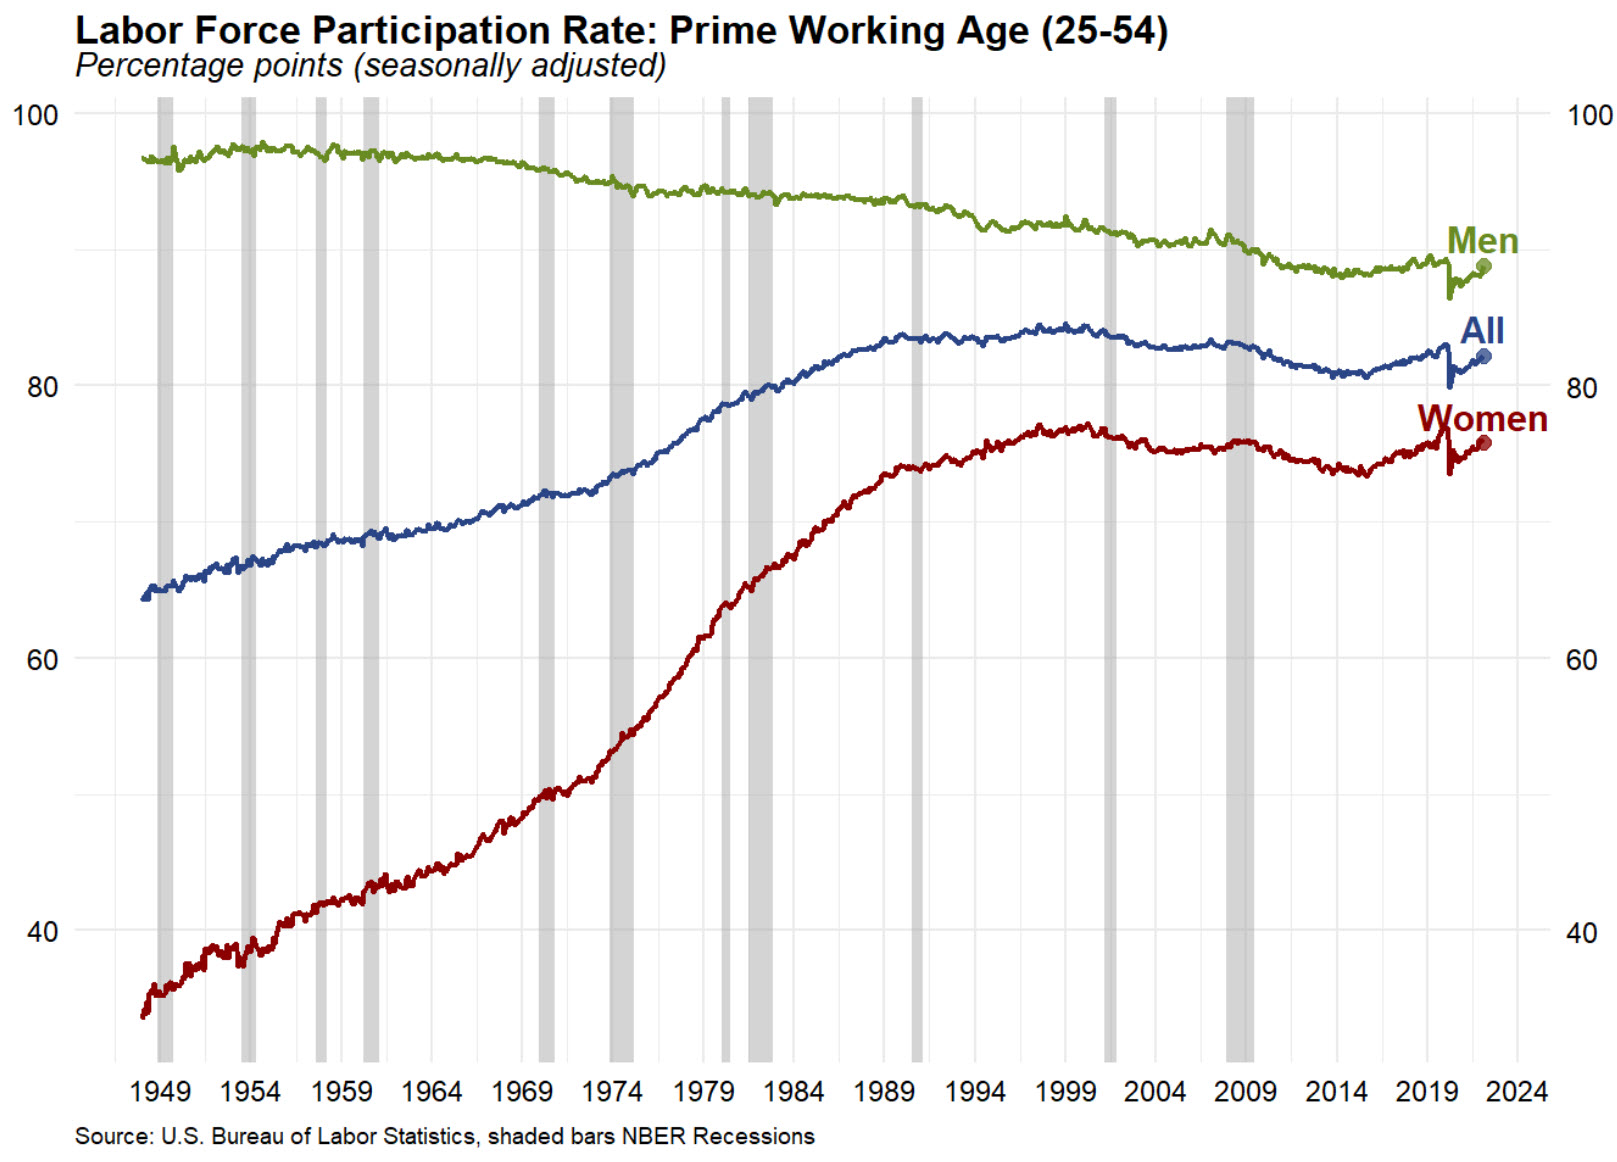
This post performs exploratory data analysis using time-series plots to visually identify essential economic information contained in the U.S. Bureau of Labor Statistics Employment Situation Report for February 2022.
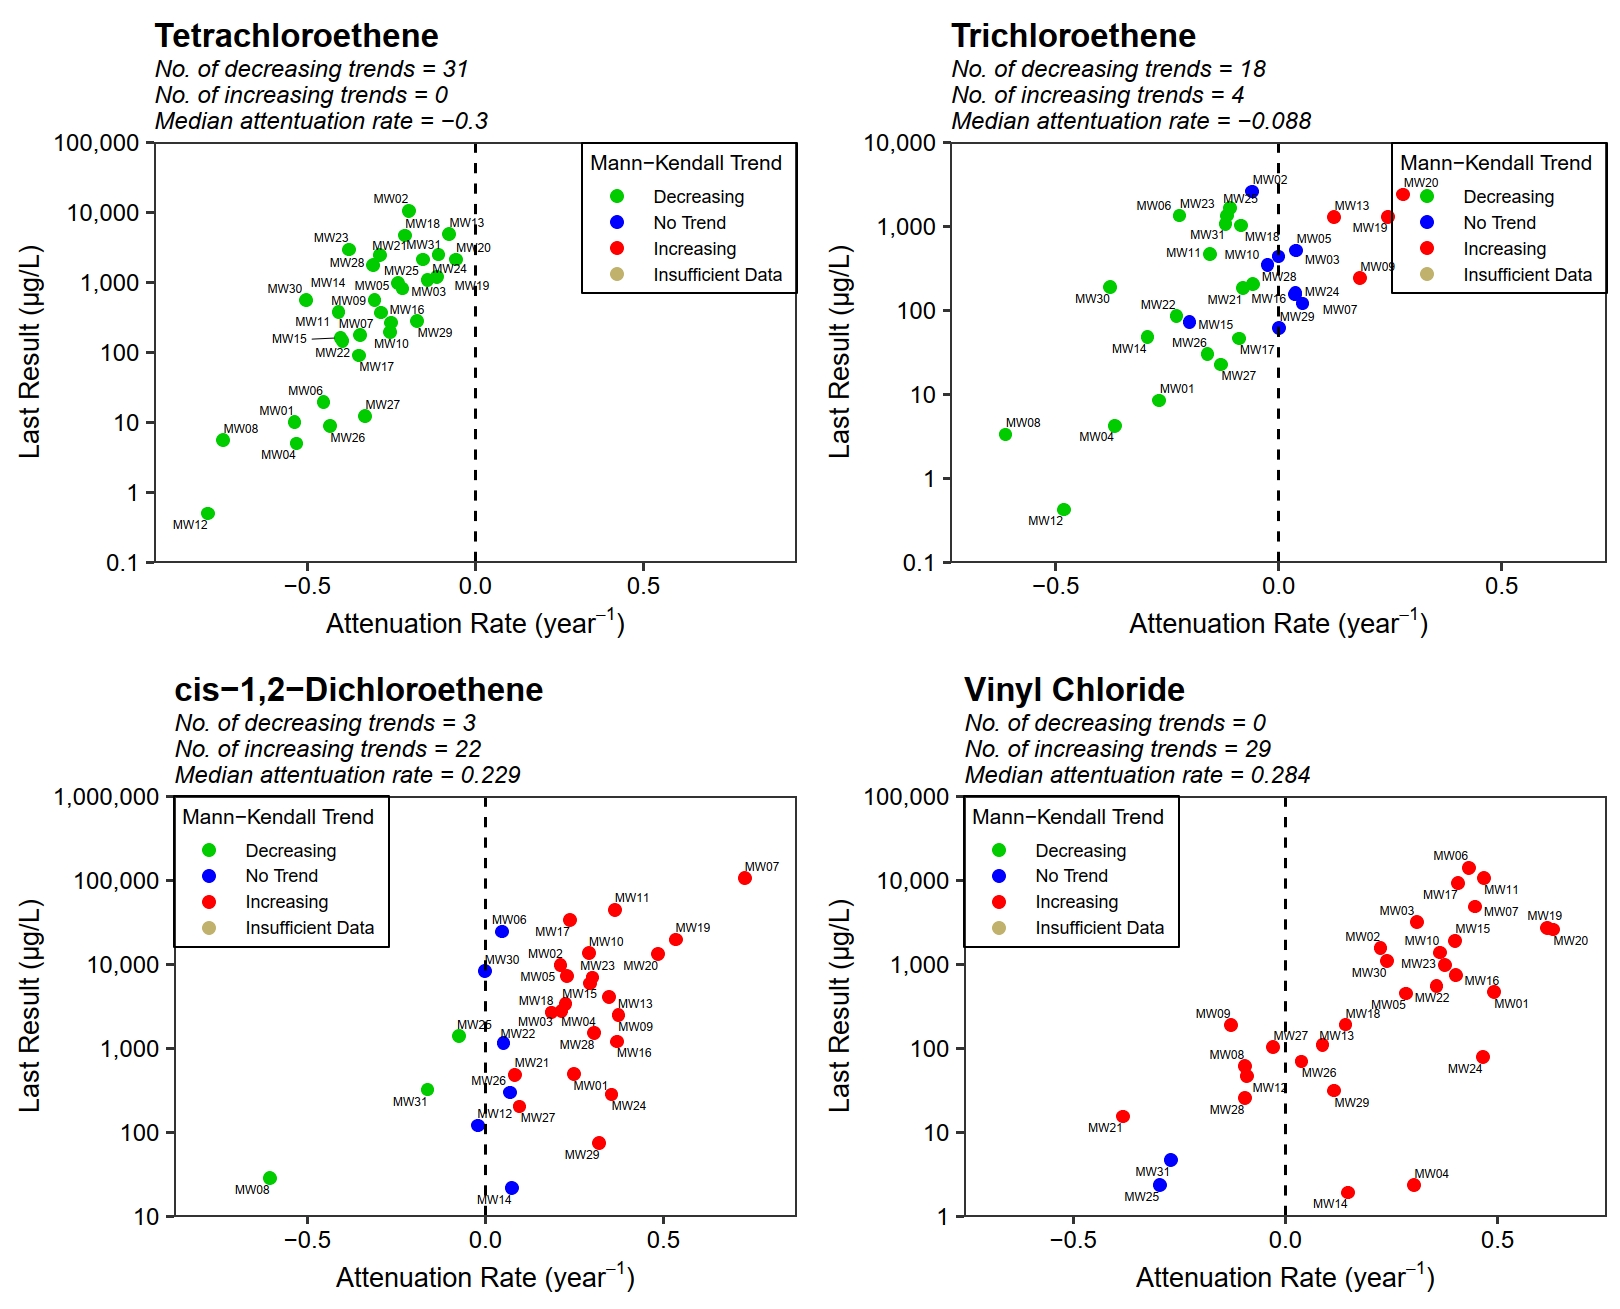
This is a brief tutorial on using R and the trendMK package for the statistical analysis of groundwater monitoring data. The trendMK package is designed to analyze censored data sets containing many sampling locations and monitoring constituents.
Perform geospatial optimization of a groundwater monitoring well network with the objective of minimizing the number of sample locations needed to represent the plume, subject to the constraint that the characteristics of the plume remain comparable.
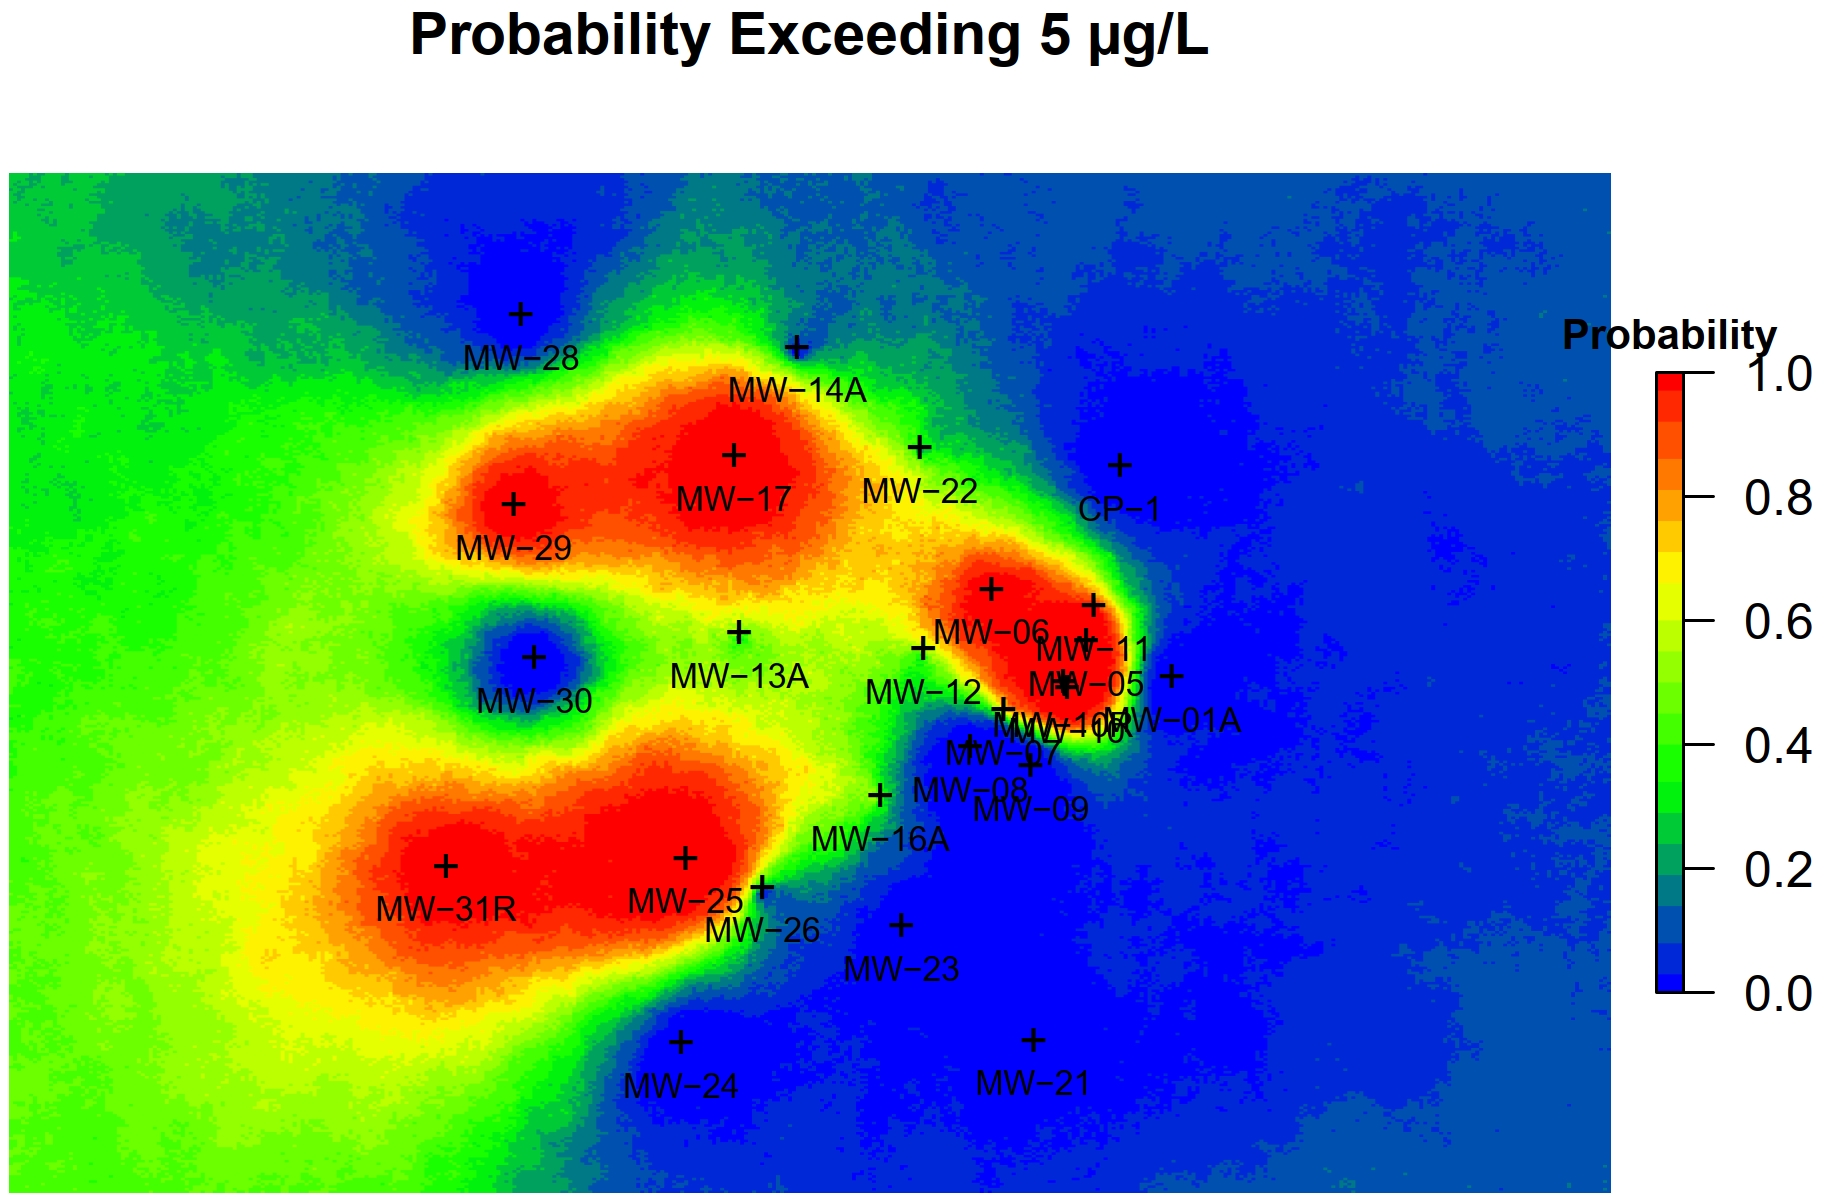
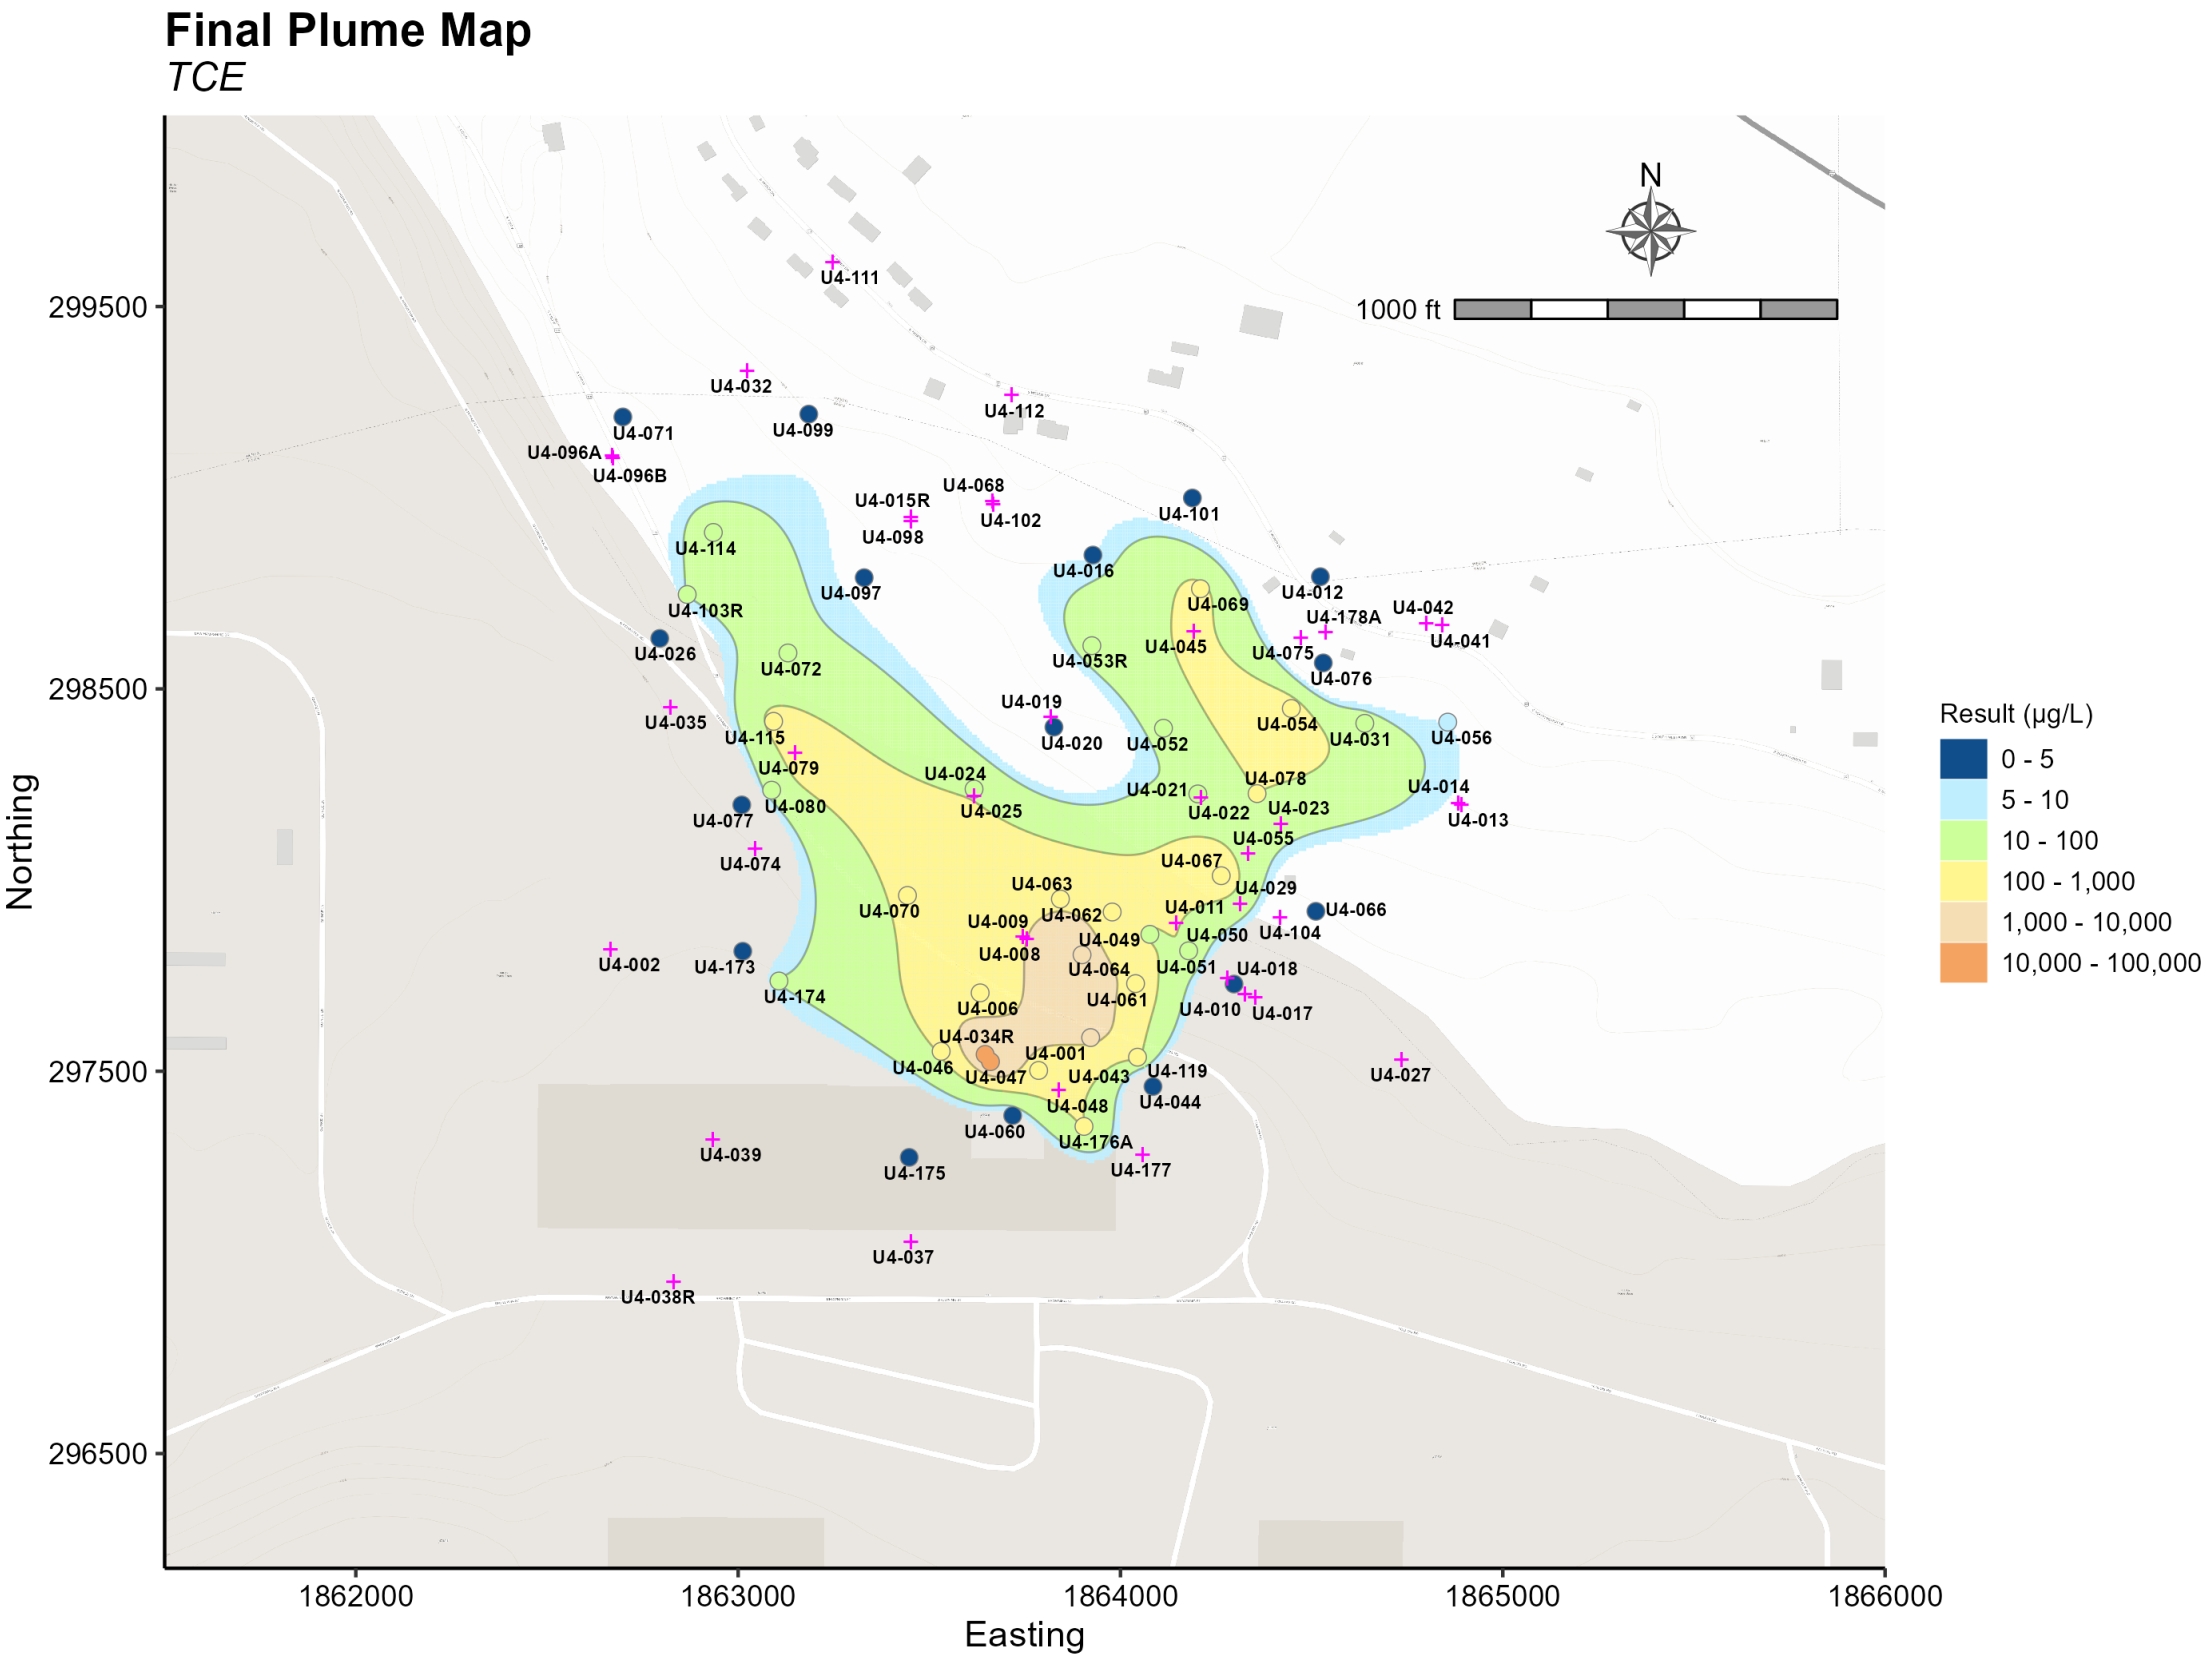
Use Sequential Gaussian Simulation (SGSIM) conditioned on measured groundwater concentration data to obtain quantitative measures of the uncertainty regarding the extent and severity of contamination at a site.