Blog

Data analytics, statistics, and more

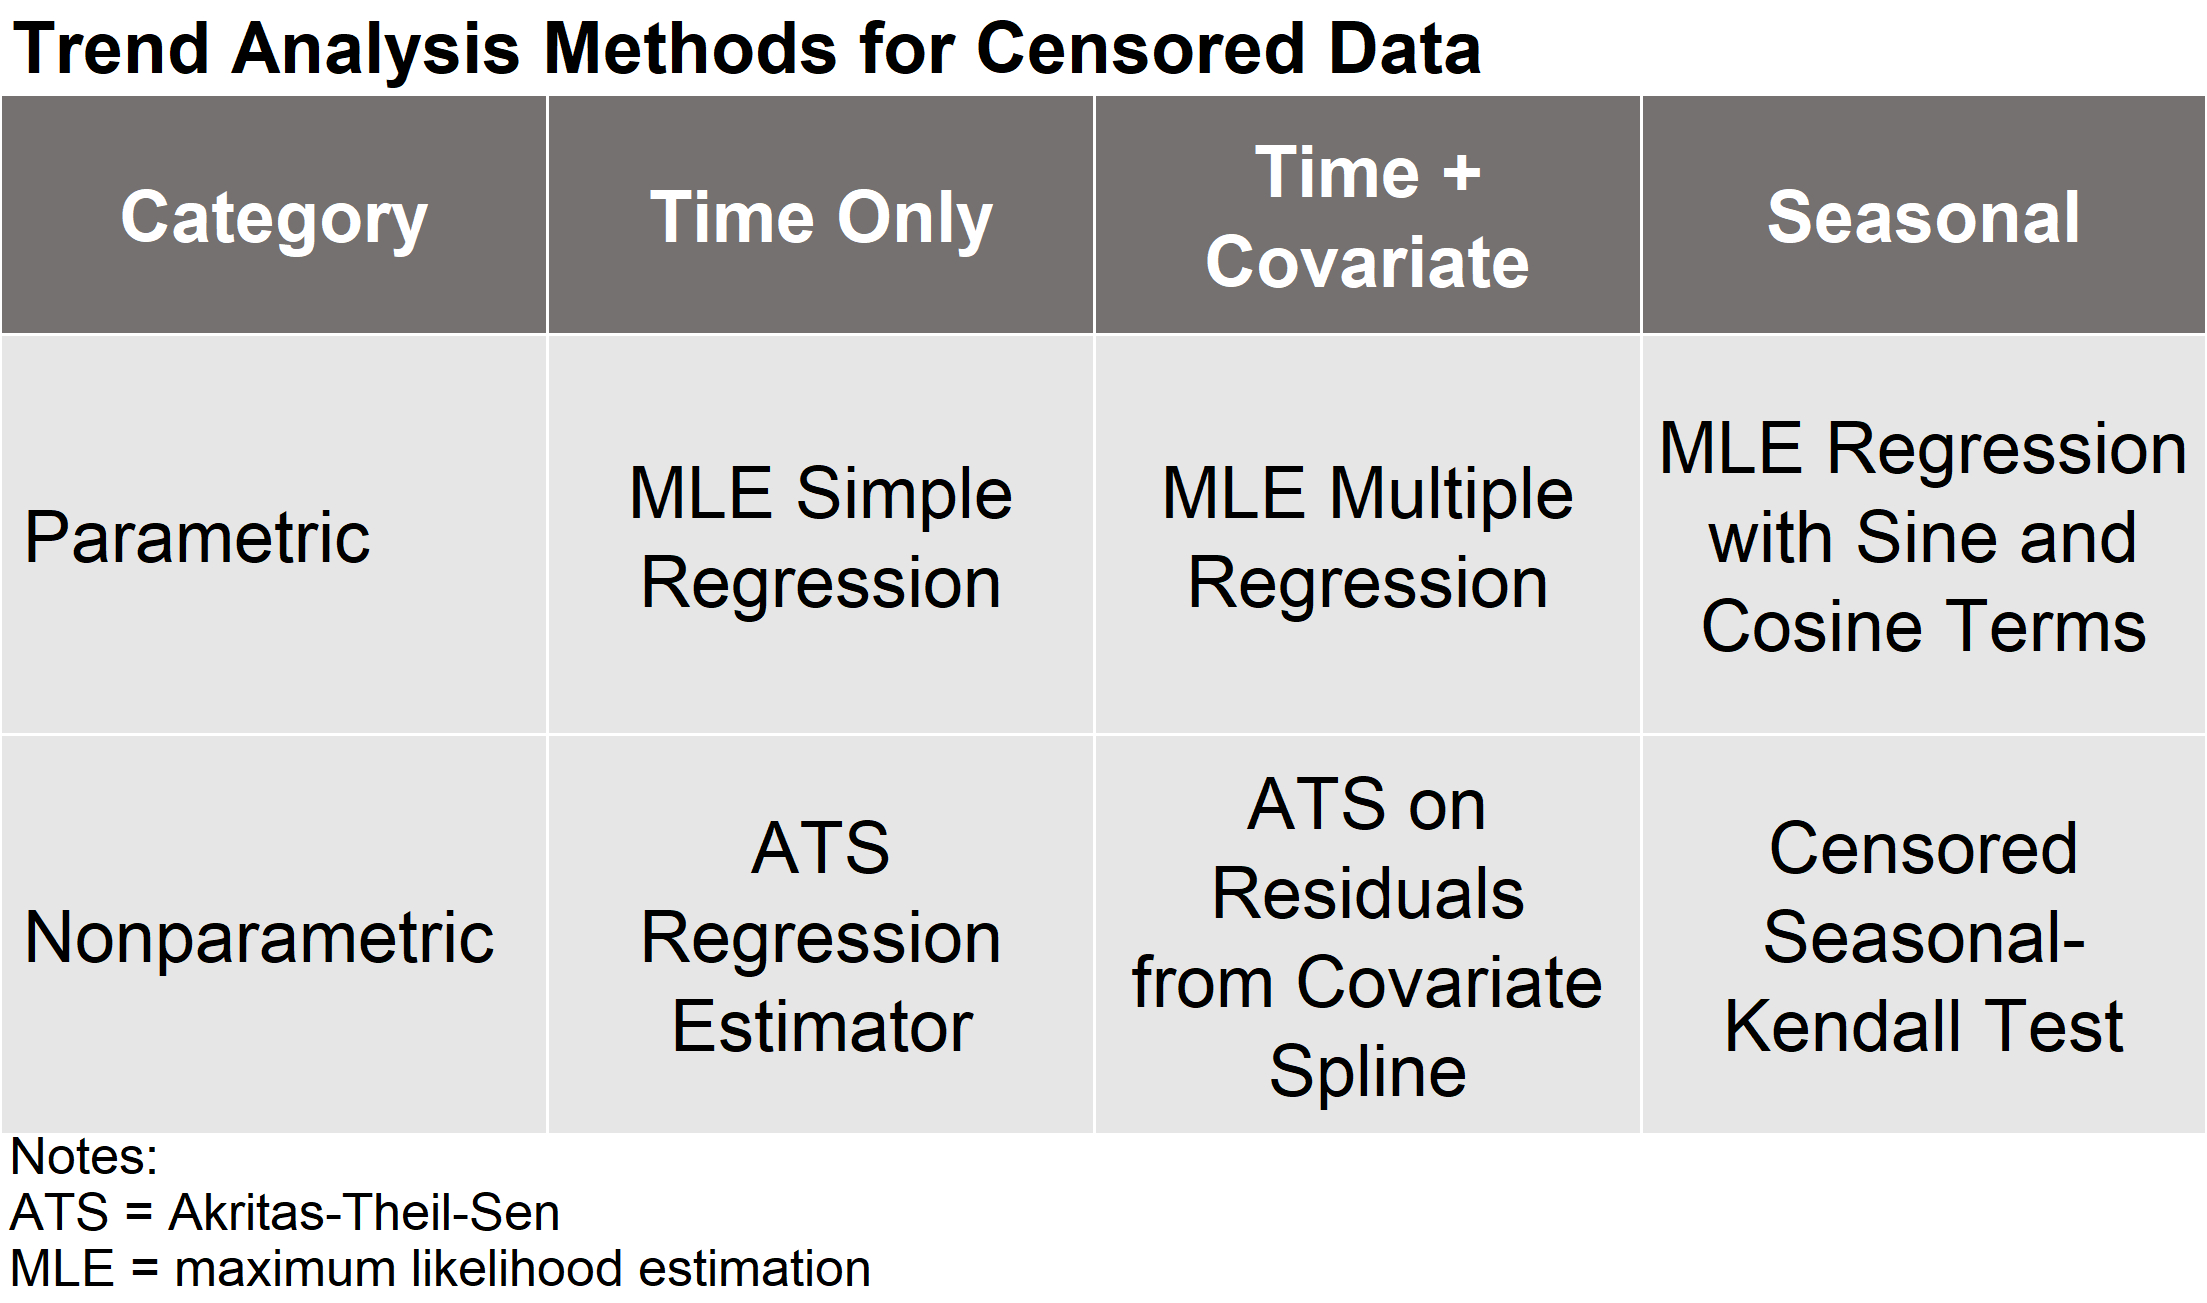
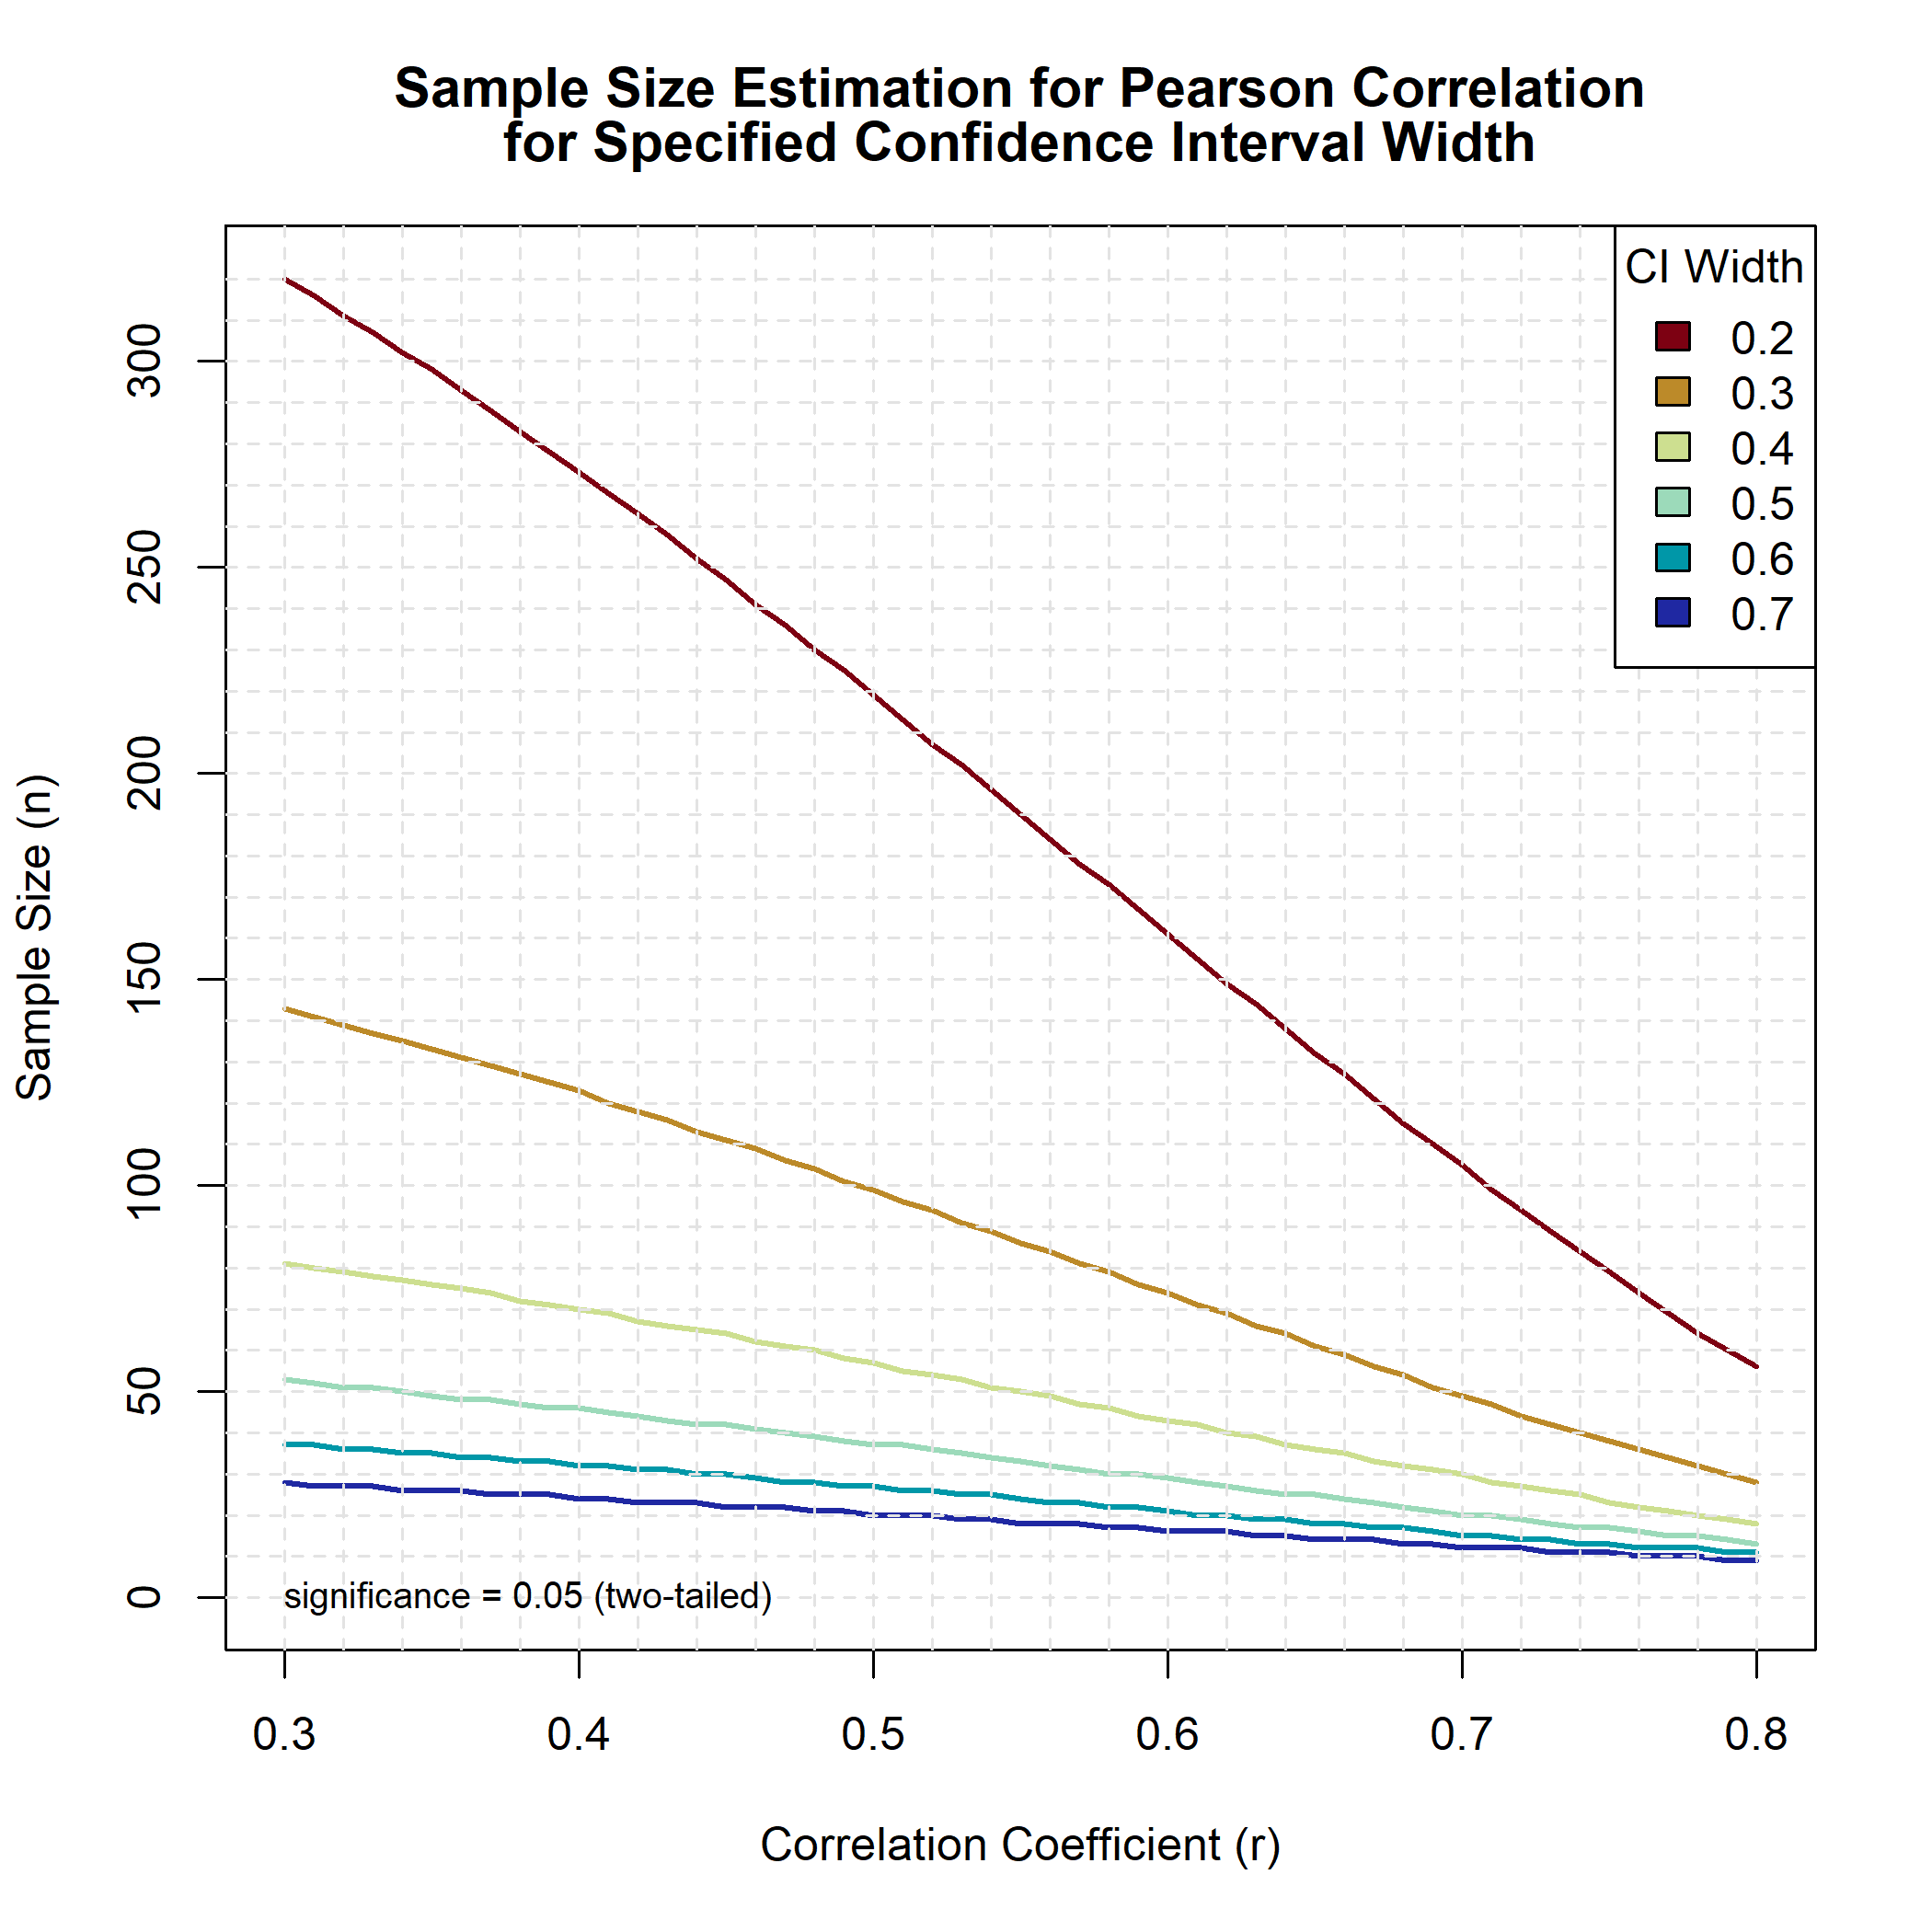
Sample Size Determination for Correlation Studies

Determination of an appropriate sample size when performing a correlation sudy is usually based on achieving sufficient power that the test can reject the null hypothesis that the correlation is zero. Sample sizes found using this method can yield confidence intervals that are so wide that they provide very little useful information about the magnitude of the correlation. An alternative approach is to choose a sample size that achieves a sufficiently narrow confidence interval for measuring the smallest correlation of potential interest.

March 25, 2023

Statistical Power of Two-Sample Central Tendency Tests with Unequal Sample Size

Two-sample hypothesis tests are used to compare the means, medians, or other percentiles of two populations to determine if there is a significant difference between the groups. For a given total sample size, statistical power is maximized if the sample sizes for each group are equal. With highly unequal group sizes, each additional observation adds little additional resolution. This simulation study focuses on determining the effect of unequal sample sizes on the statistical power of two-sample hypothesis tests, assuming independent samples with equal variance.

January 3, 2023

Two-Sample Permutation Test of Difference in Means

Permutation tests are designed to be robust against departures from normality. Permutation tests compute p-values by randomly selecting several thousand outcomes from the many larger number of outcomes possible that represent the null hypothesis. This post demonstrates how to perform a two-sample permutation test using various R packages.

December 22, 2022

Calculation of 95% Upper Confidence Limit for Data With No Censored Values

This post presents methods that can be used to calculate a 95% upper confidence limit on the mean of an unknown population, where all measurements are detections. The estimation methods described in this post are applicable to a random sample coming from a single statistical population.

November 1, 2022

Trend Analysis for Censored Environmental Data

This post examines several methods for conducting temporal trend analysis using censored data that do not substitute artificial values for non-detects. Parametric methods are based on censored regression using maximum likelihood estimation. Nonparametric methods are based on Kendall’s tau and the Akritas-Theil-Sen line.

October 7, 2022

2-D Density Map of Bigfoot Sightings

Data visualization is an important element of the data science process and the broader data presentation architecture discipline. This post will focus on performing some basic spatial data analysis using Bigfoot sightings in North America and the R language for statistics and visualization.

October 1, 2022

Shaded Relief Basemap Using rayshader

This post illustrates the use of rayshader, an R library that uses elevation data in a base R matrix and a combination of raytracing, hillshading algorithms, and overlays to generate 2D and 3D maps. A surface relief map created using digital elevation data will be rendered using rayshader and ggplot2.

September 6, 2022

Rain Tomorrow Stacked Ensemble Model

For this post, we will evaluate rainfall in Australia using daily weather observations from multiple Australian weather stations. We will build a stacked ensemble classification model using the H2O machine learning platform for use in predicting if there will be rain tomorrow.

September 5, 2022

Rain Tomorrow

For this post, we will evaluate rainfall in Australia using daily weather observations from multiple Australian weather stations. We will build several machine learning models using the tidymodels framework for use in predicting if there will be rain tomorrow.

August 28, 2022